Creating an Informative Diagram of Surfactant Protein D Dodecamers
Anatomy Physiology & Biochemistry International Journal Juniper Publishers

Abstract
Surfactant protein D (SP-D) is a C-type lectin, produced mainly by alveolar type II cells, which participates in a wide range of immune functions. Published drawings present a simplistic shape for SP-D and typically depict the molecule just as two crossed black lines with round ends. These diagrams persist in spite of the presence of many transmission electron and atomic force microscopic images that show the shape, dimensions, degree of multimerization, and luminance, as well as providing other clues about its structure. To create an informative diagram of SP-D, morphometric methods were devised to determine degree of arm separation and arc length of the curved arms, as well as a method for straightening each curved arm while maintaining pixel integrity which enabled straightforward luminance plots to be made in Image J. This method provided peak heights, widths, and areas under the curves, that revealed several new luminance peaks in the collagen-like domains, increased the width estimates for the prominant N terminus peaks, and resulted in a data-rich diagram of SP-D dodecamers.
Keywords: Scientific diagrams; Illustration; Surfactant protein D; Atomic force microscopy; Luminance; Morphometry
Abbrevations: SP-D: Surfactant Protein D; CTL: C-Type Lectin; AA: Amino Acid; CRD: Carbohydrate Recognition Domains; TEM: Transmission Electron microscopy; AFM: Atomic Force Microscopy
Introduction
Diagrams and drawings represent a critical facet of scientific communication and require the same dilligence that preparing manuscript text does to avoid “confusion” if not outright “error”. Reasons for the abundance of inaccurate illustrations include lack of funds, poor communication between scientist and illustrator, and the inability to visualize and articulate complex concepts [1]. The effort expended to create good scientific diagrams is no different than that required for writing clear scientific text. The latter undergo vigorous editing, but for diagrams submitted, careless editing is a growing problem. It becomes even more problematic with the ease of “reuse, reiteration, and redistribution” of erroneous diagrams through electronic media. Communicating scientific principles as graphics began millenia ago on cave walls and papyrus [2-4] well before written language, which quickly became the dominant mode of scientific reporting. Good science however, employs both modalities: accurate text as well as accurate graphics. An example might be the drawings of the well-studied and very important surfactant protein D (SP-D) (Figure 1), which are stick figures at best and offer very little in the way of data. But, applying simple morphometric methods to existing microscopic images and protein structure data for SP-D, can greatly enhance the delivery of information about SP-D dodecamers.
Surfactant protein D (SP-D; pulmonary surfactant associated protein D, SFTPD) is part of an evolutionarily conserved C-type lectin and lectin-like superfamily (CTL/CTLD) involved in generalized defense mechanisms. They can discriminate healthy and pathogen-infected cells and organisms, as well as assist with the aggregation of some bacteria, viral and fungal pathogens through pattern recognition of their coat glycoproteins [5-7]. SP-D is primarily produced in alveolar type II cells and some bronchiolar epithelial cells in lung but has been found in more than two dozen other cell types of endodermal origin [8]. The gene for human SP-D lies in a localized cluster of genes encoding C-type lectins on the long arm of chromosome 10 [5]. SP-D knockout mice, mice with humanized SP-D, transgenic mice with single nucleotide polymorphisms, rat recombinant SP-D and SP-D from many other species have been well researched [7-17].
Human SP-D is synthesized as a 375 amino acid (AA) precursor which contains a 20 AA signal peptide, a 25 AA N-terminus, a 177 AA collagen-like domain, a coiled-coil neck domain which appears to provide some flexibility for positioning each of the C-terminus 106 AA C-type lectin domains. The molecule typically comprises tightly wound homotrimers. N termini are joined end to end, then the molecule is coiled in the adjacent collagen-like domain through the coiled-coil neck region ending with the three carbohydrate recognition domains (CRD). The N terminus and collagen-like domains of SP-D are critical for immune functionality [5,17].
Electron microscopy (TEM) and atomic force microscopy (AFM) show that SP-D exists in various oligomeric states (monomers, dodecamers and multimers) and accompanying many of these manuscripts are drawing/diagrams of SP-D [7,8,11,18,19] (Figure 1). SP-D multimers (fuzzy-balls) are usually spherical and can have 26 arms (or more). The mean number of arms found in published images for SP-D fuzzy-balls was 16.11+/0.9 (n=35) supporting the concept that multimers may be built incrementally with the more common form, dodecamers [5].
Protein models of the trimeric CRD and neck region of the SP-D are plentiful [20-22], but modeling of the N terminus and collagen-like domains lack confidence. However, many elements of shape can be inferred from micrographs where there is sufficient information, at least, to construct a more informationrich diagram than appears in most publications, some of which, modified slightly, are shown in Figure 1. More than 25 such cartoon diagrams of SP-D dodecamers (similar to the 4 in Figure 1) were assessed for how closely they resembled actual microscopic images. Discrepancies were countless, for which some authors claimed “artistic license”, while others showed great detail, but still failed to reflect the data provided by microscopy [7,17].

Methods and Results
At least 50 published images of actual SP-D dodecamers (TEM and AFM) were examined carefully for characteristics that might suggest ways to enrich drawings. From those images 5 AFM micrographs (10-15 dodecamer arms) were randomly selected with which to create a morphometric method to obtain sufficient data to create such a diagram. ImageJ (image analysis software) [23], CorelDRAW x5 (vector and raster imaging software) [24] and Excel were used to gather the following values from those micrographs:
a. Individual dodecamer arm length, (arm arc length when arms were curved).
b. Arm angles (the acute and obtuse angles between the four arms of the dodecamers).
c. Widths (nm) of the N terminus juncture, collagen-like domains, and width of the coiled-coil neck and CRD domains.
d. Area under the curves.
e. Luminance values (look up tables (LUT)) along each dodecamer arm.
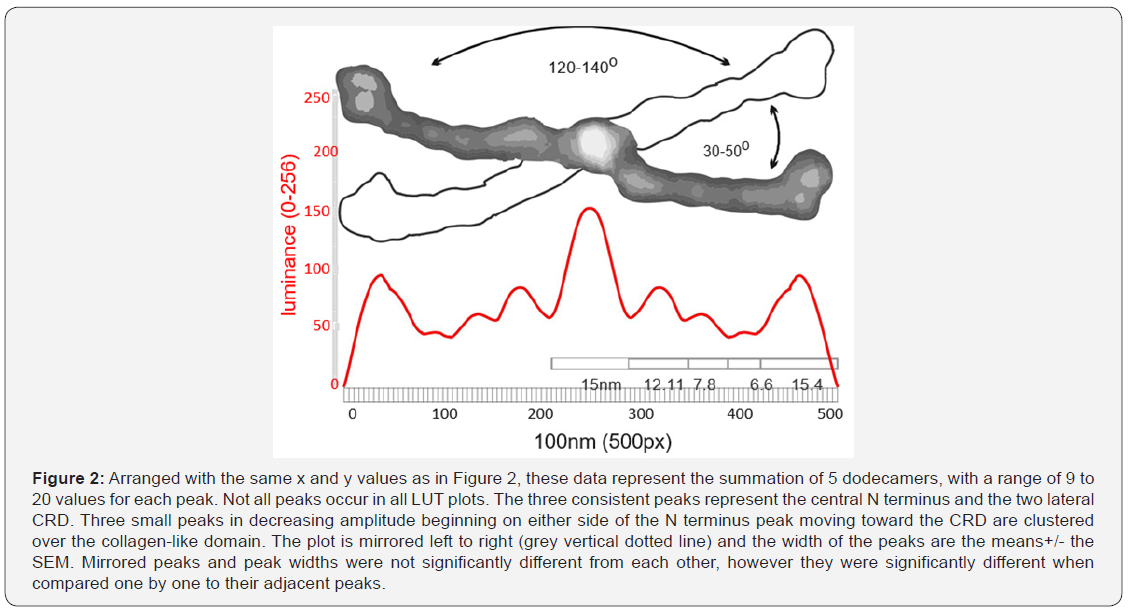
SP-D dodecamers by consensus are approximately 100nm in diameter (CRD to CRD) and so all images were standardized to a width of 500px per 100nm. This was necessary because some published images had micron markers which deviated significantly from that concensus value [10,11,18]. It was also necessary to devise a way to straighten the many SP-D arms which fell into curved shapes during preparation, so they were compatible with functions in Image J. The acute angle between two arms was within the range of 30-50o with corresponding obtuse angles of 120-140o (Figure 1 and 2) and was influenced by experimental conditions (e.g. pH) [25].
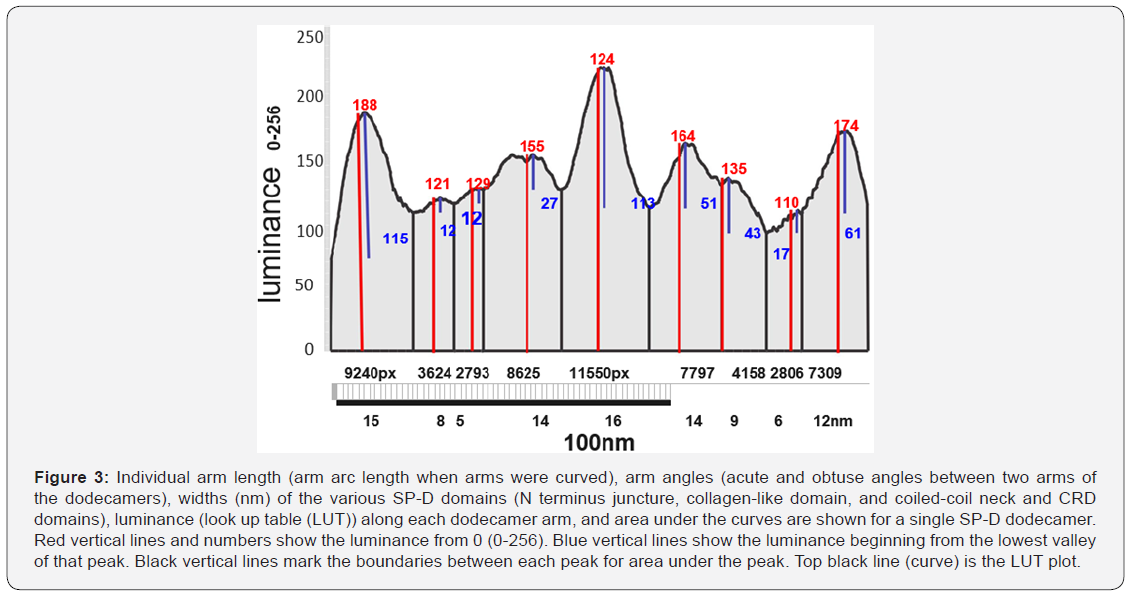
Curved arm length was measured to confirm that all arms were relatively close in length to straighter arms. To begin, dodecamers were rotated to align one set of arms horizontally, then background was trimmed with an eraser tool. If the arms were curved, they were cut vertically at 1nm intervals, and these slices were centered horizontally and normalized to 100nm. This provided a straightened image of the curved arms at their presumed true length. Images were then exported (300ppi, rgb, tif, 500px 100nm width) for analysis of luminance (greyscale 0-256) (LUT) using Image J. LUT were determined for the full length of the dodecamer arms, using single lines (500px x 1) as well as with rectangles (500px x 15 or 500x20px). These luminance values were saved to Excel, plotted, then imported into Corel DRAW to measure number of peaks, width of the peaks at their lowest points (nm), and peak heights (nm) and areas under the curves. Means +/-SEMs were calculated [23]. Figure 2 summarizes the values from a single dodecamer. Differences between adjacent peak heights and widths were assessed (n=9 -15 arms) [26].
Nine peaks were present in most LUT plots (Figure 2). The highest peak (also the most obvious structure in the AFM images) is at the N termini where the arms of the dodecamer meet (the center of the molecule coincides with the center of the plots) (luminance=150 points above background with a peak width of 15nm). The N terminus sequence codes for just 25 AA and would be expected to be only a few nm in width yet TEM and AFM images frequently show it as a wider portion of the whole molecule than expected. This suggests that the point of separation of the dodecamer arms (creating the arm angle) might include part of the first exon of the collagen-like domain. An n-glycosylation site is present at a location (according to the several diagrams [5,27] that might account for the increase in observed peak width at the N terminus. The greater width of the N terminus in the direction of the acute arm angles creates a bilateral molecule, rather than one of radial symmetry. This has implications for constructing a fuzzy-ball diagram.

Peaks for the CRD were also prominent (Figure 3) (luminance of 115 (left) and 61 (right) points above the curve origin and 180 and 174 points respectively from 0). Peak width was just over 15nm. CRDs were routinely lower in luminance than the N termini but were similar in width. The CRD peaks frequenly showed minor valleys owing to the three-rounded shapes of the CRD heads lying in different positions, actually discernable from AFM images.

Along the collagen-like domain there were three peaks, each mirrored in the other half of the molecule. The first peak (closest to the CRD peaks) had the smallest peak height and sometimes was absent. The middle peak was of greater height and width and more consitently seen. The largest peak in the collagen-like domain (adjacent to the N terminus peak) was the highest along the collagen-like domain and was almost always prominent. Morphometric analysis of additional dodecamer arms should substantiate (or refute) the existence of the smallest of the three peaks in that domain. Each of the three peaks was not statistically different from its mirror peak, however the summary data of small, middle and largest peaks were significantly different from their adjacent peaks. The coiled-coil of the neck region does not appear, as yet, to be a distinct peak, but may be seen with a larger sample of molecules.
A summary diagram of SP-D could look something like Figure 4 where the greyscale values for the different domains and peaks correlate with the actual LUT values and the size (100nm) correlates with what is reported in the literature. The dotted line indicates where the other two arms of a dodecamer would be with acute and obtuse angles in correct dimensions. Relative thickness and shape are directly taken from an AFM image.

Conclusion
A summary drawing for SP-D dodecamers must include an accurate rendition of proportions (relative size, width and thickness derived from micrographs and molecular models, as well as reflect the luminance (relative peak heights) gathered from LUT tables. It is an imperative that figures, drawings and diagrams depict valid scientific data. This diagram for SP-D is based on a morphometric method customized for the purpose of creating such a diagram. The methodology described is straightforward and should be bias-free and readily applicable to additional C-type lectins and other proteins.
To Know More About Anatomy Physiology & Biochemistry International Journal Please click on:
For more Open Access Journals in Juniper Publishers please click on:

Comments
Post a Comment